
Question
7-days average
Hello,
Making a chart with date in X axys with the number of tickets may be not really relevant as somedays you have less more tickets (sunday for example) and so it's difficult to see clearly a trend.
The trend with the pandemic and figures related is the 7 day average, for example on Google :
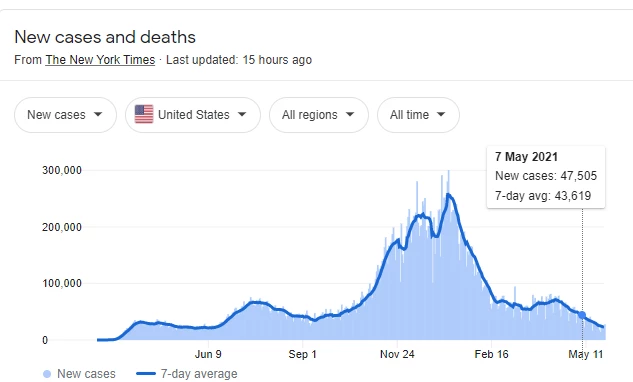
I am trying to do that on Explore (for each day compute an average on the last 7 days) but I did not find a way to do it (don't know if it is possible).
Does someone succeed to do a such metric ?
Thanks