I want to create a graph that shows the number of created (vs solved) tickets per date for the chosen attribute. However, as soon as I choose the attribute the date range drops.
I can see the date range in the query editor:
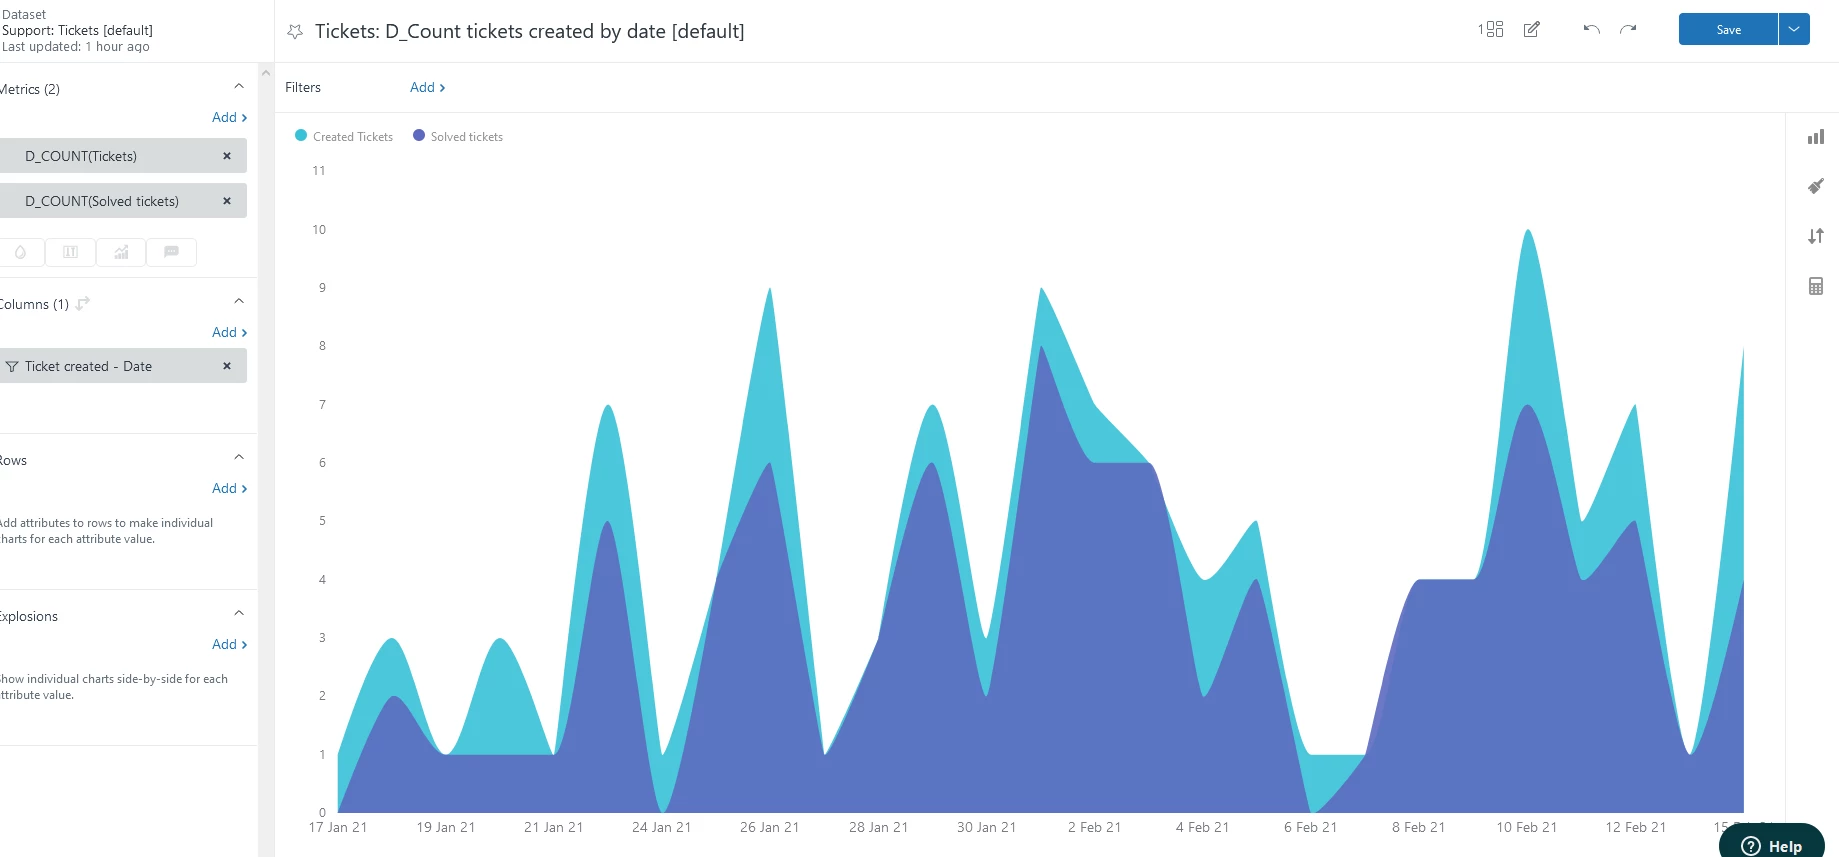
But not anymore in the dashboard after selecting an attribute:
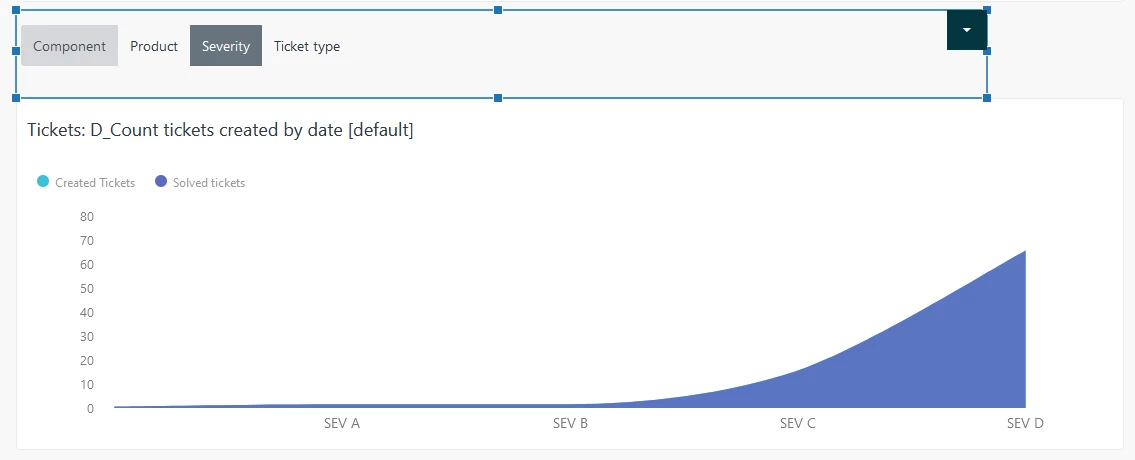
Does anyone have an idea on how to work around this?