
Question
Unsolved tickets displayed per week and age bracket?
Hello all,
I am trying to build a simple report with a chart that shows the number of unsolved tickets in each age bracket over time. E.g. week-by-week over a rolling 3-month period.
My starting point is the table below but I'm completely at loss as to display it in a graph (or table) per week.
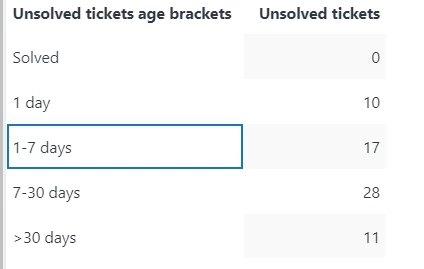
Has anyone manage to solve such an approach?
Many thanks in advance!
/Love