
Zendesk Expore - Agent Activity data | The place for Zendesk users to come together and share
Skip to main content
David76
May 12, 2022
Question

Zendesk Expore - Agent Activity data

  • May 12, 2022
  • 7 replies
  • 27 views

I came from a different reporting solution which allowed me to show agent comment activity over a work day. 

It looked something like this:
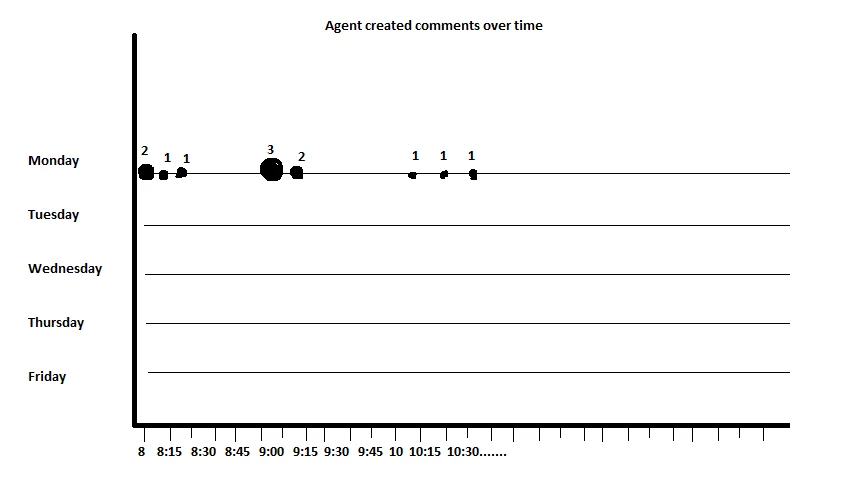
This was crucial for monitoring agent performance remotely. Now that I'm using Zendesk, I cannot seem to find a way to do this using Explore.

Am I missing something?

Sorry if this was a silly question.  

    7 replies

    May 12, 2022

    Hi David - Not a silly question at all! A few years back, my boss had asked me to build the same exact type of report but I wasn't able to find a way to achieve this, I'm afraid.

    That said, we did end up building a heatmap similar to the one shown here which we have found to be really helpful. You'll want to build this heatmap in the Ticket Updates dataset and use a metric like Agent Comments or even Public Comments, depending on your use case. 

    May 12, 2022

    This is crazy - in the last piece of software I was using the reporting was far superior, and getting agent activity throughout the day was extraordinarily easy. Thanks for the tip with the heatmap, we've been looking at a way to monitor this too. This will hopefully suffice until there's some improvement in the analytics capabilities :)

    Lou11
    May 12, 2022

    Would something like this be helpful?

    I have this query set up for each agent. I then threw them all in a dashboard, each with its own tab (as well as a tab with all agents), and a selectable date range. Very useful to management.

    This is the dashboard with the tabs covered up to protect the names of the guilty :D

    David76
    David76Author
    May 12, 2022

    Thanks for the quick response @Chandra Robrock

    At first I thought.. wow it's working, but then I realised the data was wrong (I don't have any agents updating tickets on the weekend)


    I think the problem here is that I'm unable to map a day of the week by calendar, instead it's showing day updated, and it's aggregating all Mondays etc..

    Here is how I've set up the report:


    Am I missing something? 


    @lou11 I'm unsure how your query is built, are you just showing agents owned tickets and then showing the update date?If so that could be ok for manual checking, but I don't see how that differs from looking at a specific agent profile, and also unsure how you can look at it via a whole group as you're looking at via the ticket level. Sorry if I've misunderstood.

    Lou11
    May 12, 2022

    The query shows all activity, no matter who owns the ticket. The date is the update date. As far as the whole group, I just change the agent parameter to include all agents as opposed to 1.

    Here's how the query is basically built:


    David76
    David76Author
    May 12, 2022

    Thanks @lou11 I'll give it a go later. I just spent an hour trying to build the activity heat map and it was a terrible experience.. I need a break lol.

    I'll circle back once I've given this one a go. 

    May 14, 2022

    @david76 - to stop the query aggregating all Mondays, you probably want to add a date filter into the mix (e.g. this week / last week)

    No pretty heatmaps in the below, but for an idea on how I've set this up before: