
Our organization is using a real-time monitoring home dashboard to monitor a number of solved tickets.
I expect to see how many tickets were solved each hour.
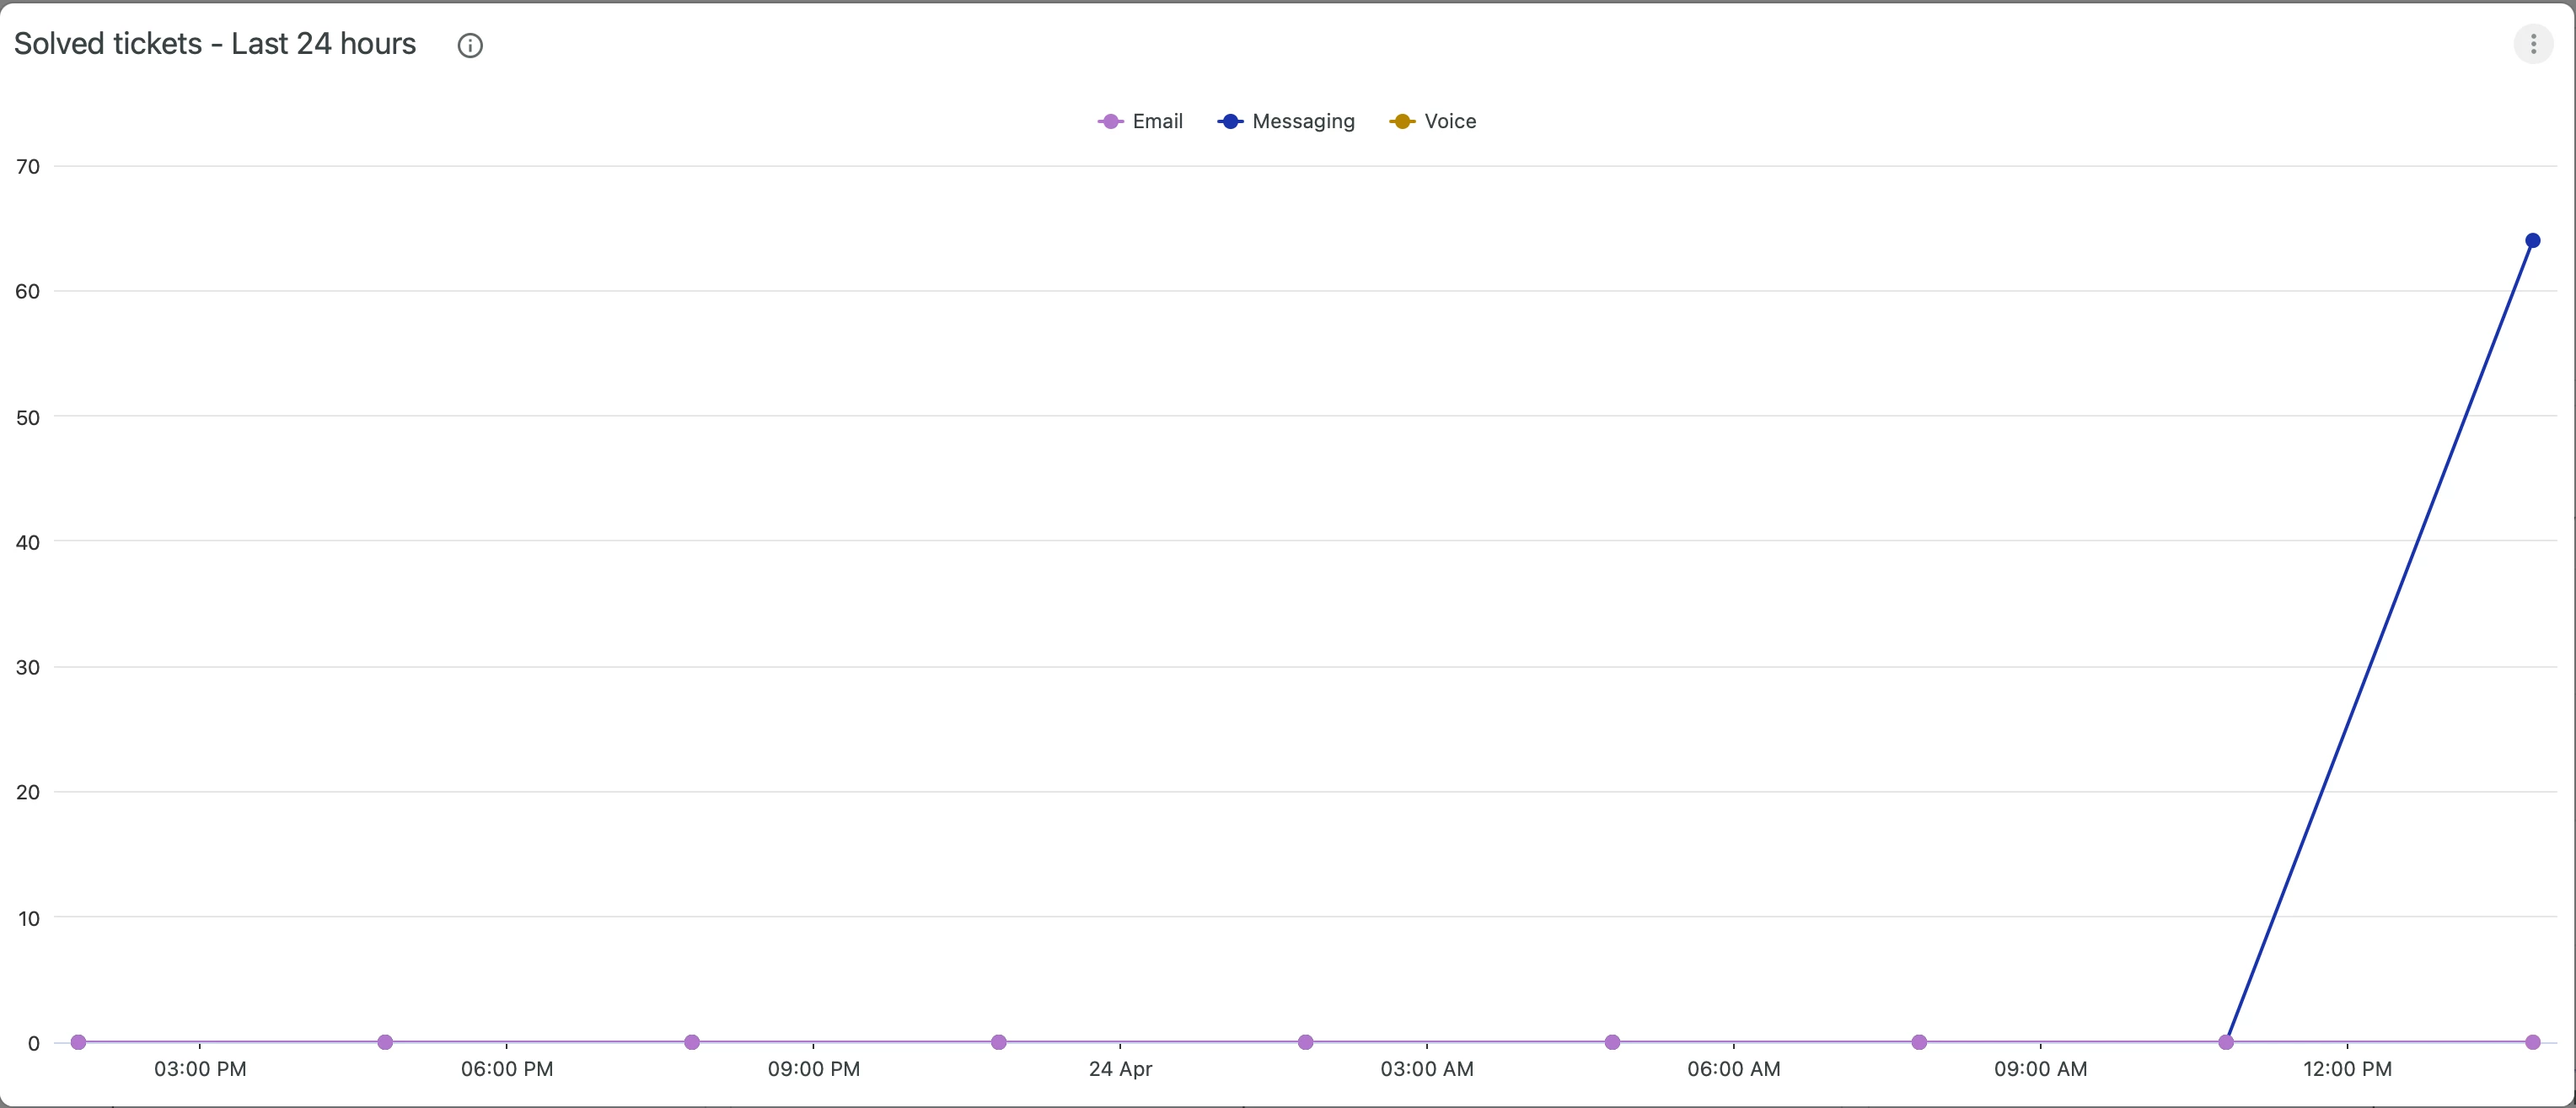
If I build the last 24 hours solved tickets as a historical data report, it looks like this:

But in the real-time dashboard, it looks completely different
Can someone explain the difference?